![Untitled design (24)-1.png]](https://help.zenventory.com/hs-fs/hubfs/Logos/Untitled%20design%20(24)-1.png?width=60&height=60&name=Untitled%20design%20(24)-1.png)
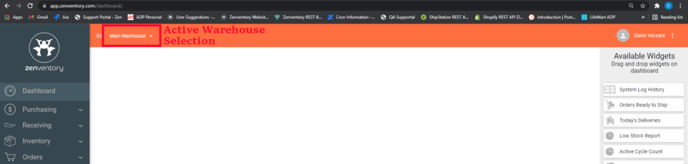
On each login, users start out on the Dashboard section of the interface. This dashboard is customizable to each user with available widgets based on those users' assigned roles within the system. For more information on user assigned roles, go here.
NOTE: The dashboard does not auto-refresh. You can refresh your browser page or navigate away and come back to the dashboard to refresh the current displayed information.
For reference in this article, "current active warehouse" means the warehouse you have selected and are working in. To determine which warehouse is currently active or to change the active warehouse, use the warehouse pulldown menu in the top bar of the interface.
The default dashboard now includes an overview widget that shows order, shipment, and sales information for a preset or customized date range. On the left is an interactive world map where you can hover over a country or state and see the specific information related to that country/state/province. USA and Canada allows you to click on them and zoom in to the state or province level. The graph on the right will show you a solid line graph of data based on the preselected date range as well as a dotted line of the previous date from a selected date range. For example, if you have selected Date Range of Last 30 days, the dotted graph line is showing you date from 31-60 days in the past for comparison. This overview can be "hidden" by selecting the 3 dot icon in the top right corner of the widget display. Once hidden, it can be re-displayed by clicking the "show overview" button on the bottom right of the available widgets panel on the right side of the dashboard screen. 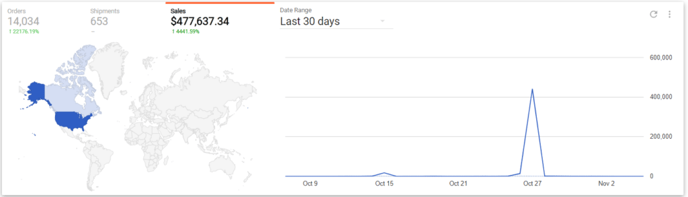
Other Available Widgets:
Depending on your specific user roles, these are the available widgets and their functionality. In order to make a widget active, simply click and hold on it from the Available Widgets grey column on the right side of the page and drag it to the center white area of the interface and let go of the mouse button.
- Open Orders - shows the amount of open orders based upon your current active warehouse. Clicking the orange "more details" button will take you directly to the Orders>Open Orders page of the interface.
- Unallocated Orders - shows the amount of orders, in your current active warehouse that have any items on the order that were unable to be allocated based upon not having enough inventory in stock. Clicking the orange "more details" button will take you directly to the Orders>Allocate page of the interface.
- Orders Ready to Ship - shows the amount of orders in a Ready to Ship state in your current active warehouse. Clicking the orange "more details" button will take you directly to the Orders>Ready to Ship page of the interface.
- Today's Deliveries - shows information regarding open purchase orders for your current active warehouse
- Expected Today: total number of purchase orders with receive dates matching the current date
- Today's Total Items: total amount of items across all open purchase orders with receive dates matching the current date.
- Today's Total Value: total dollar value of the cost of the items across all open purchase orders with receive dates matching the current date. Item's without predefined unit costs will not be calculated into this total.
- Late Deliveries - total number of open purchase orders that have receive dates prior to the current date.
- Graph - shows a graph of total open purchase orders expected in the next week, per day. Also shows the total number of open purchase orders that are late.
- Low Stock Report - displays a graph of items that are below their "reorder" level and/or fully depleted for your current active warehouse. Clicking the orange "more details" button will take you directly to the Inventory>List Inventory>Low Stock page of the interface.
- Active Cycle Count - displays the total number of available open cycle counts and total number of cycle counts completed and awaiting approval in both the current active warehouse and across all warehouses. Clicking the orange "more details" button will take you directly to the Inventory>Cycle Count page of the interface.
- Expiring Stock - displays a graph showing items that are set to expire soon. The expiration expiring stock threshold can be customized by going to Admin>System and changing the "Inventory expiring soon alert threshold" to a number of days of your choosing. It defaults to 90 days. Clicking the orange "more details" button will take you directly to the Inventory>List Inventory>Expiring Stock page of the interface.
- System Log History - displays information on errors, and other useful system information with regard to integration functionality. Clicking the orange "more details" button will take you directly to the system log details page of the interface.
- Zenventory News - displays links to blog articles on the Zenventory website. "More Details" is a nonfunctional button in this widget.